INTRODUCTION
The Montreal Cognitive Assessment (MoCA)1 is a simple and user friendly tool widely used for screening mild cognitive impairment (MCI), a transitional stage between normal aging and dementia. With a score between 0 and 30 points, the MoCA has the ability to assess multiple cognitive domains1,2; it has been used in more than 200 countries in different languages, and available for clinical and educational use from www.mocatest.org.
Many researchers have validated the MoCA test; the vast majority of such studies were with patient populations - those at risk or already diagnosed with cognitive impairments. Koski3 summarized this literature within the context of cerebrovascular diseases, where cognitive impairment is a common consequence. In many studies, the MoCA test and subtests have primarily been validated against either a clinical diagnosis or the Mini Mental Status Examination (MMSE) score, another tool also widely used for MCI screening.4 In more recent validations of the MoCA test in languages other than English, the test scores were also compared between groups with and without a clinical diagnosis of cognitive impairment.5–7 Research with a community-based sample, where the MoCA and MMSE scores were compared8 or the internal reliability and construct validity of the MoCA test were examined remains limited.9–11 A recent study of the MoCA test in Vietnamese included a very small sample (n=7) of Vietnamese older adults who had been diagnosed with dementia or neurocognitive disorder.12
Several medical conditions associated with increased risks of cognitive decline were common among Vietnamese. For instance, compared to other Asian American subgroups, VA women had the highest rates of stroke and dementia.13 VAs also have markedly higher incidences of cervical and liver cancer compared to any other ethnic groups. In addition, Asian Americans in general are at a particularly high risk for viral hepatitis.14 These co-morbid factors can put Vietnamese older adults at an increased risk of cognitive decline. Therefore, effective early detection of cognitive decline, using appropriately validated test such as the MoCA, is important for this population as the MoCA test in Vietnamese has not been validated with a community-based sample for early MCI screening. This present study seeks to fill this gap by assessing the performance of this test with a community-based sample of Vietnamese American (VA) older adults aged 60+ in the New Orleans area.
METHODS
Data
This validation study employed data from structured surveys with VA older adults in the New Orleans area. Ethical approval (No. 2018-2046) was obtained from the Tulane University’s Institutional Review Board (IRB); participants provided verbal consent prior to the interview. The interviews took place in January-March 2020. Participants were selected from members of a local elder club, using the following criteria: (1) be Vietnamese American aged 60 to 90; (2) reside in the New Orleans metropolitan area; and (3) can hear, see, and read. The upper age limit was due to the number of older adults aged 90+ who had visual or hearing impairments and could not complete the survey during pre-test.
The survey included a wide array of questions about physical and mental health, awareness of Alzheimer’s Disease, etc., that took approximately 90 minutes to complete. A total of 50 VA older adults were interviewed; two participants were excluded from this analysis because visual impairment prevented them from completing the MoCA test, resulting in a final sample of 48 older adults. The sample size was determined primarily by the feasibility of fieldwork given the level of funding and the timeframe of the project.
Revision of the MoCA instrument
Four bilingual research staff completed the training on the MoCA test administration. The MoCA test in Vietnamese version 7.1 was used for pre-testing, after which, several revisions were made for the questions to be culturally appropriate, while maintaining their purposes and levels of difficulty. Specific changes were as follows:
- Trail Making: alternating between numbers and letters was changed to alternating between numbers and the number of dots corresponding to the numbers. This was done because all VA older adults had difficulties during pre-test following the original instructions of alternating between numbers and letters.
- Memory: the word “face” in English was translated as “vẻ mặt” (i.e. facial expression) in the MoCA Vietnamese version 7.1. We used “khuôn mặt” (i.e. face, shape of face) instead for a more direct meaning.
- Fluency: letter L was replaced with letter H because it was perceived that it was too easy to come up with six different words beginning with letter L just by changing the tonation of the same spelling. In Vietnamese, one word can be spelled the same but carries different meanings with different tonations.
- Abstraction: the “train-bicycle” pair was replaced with “bicycle-airplane” to avoid being a leading question. In Vietnamese, “train” means “xe lửa” and bicycle means “xe đạp”; the word “xe” suggests that this pair belongs to the transportation category.
Statistical analysis
The small sample resulted in a respondent: item ratio of approximately 1.5:1. The analysis of the scale’s performance, conducted using Stata/SE version 15,15 involved three components. The first component was a content analysis where the percentage of correct response to each test item was examined. Pearson correlation coefficients were performed between 1) each item or domain and the total, unadjusted score, 2) each item and each cognitive domain, and 3) between cognitive domains to assess the discriminating power of each item or cognitive domain.16 Significant correlation coefficients indicate factorial validity; we also expected to see high correlations between items and domains following the conceptualization of cognitive domains by Nasreddine et al.1 Cronbach alpha was used to assess the test’s internal reliability.9,17
The second component was a construct validity analysis, using Confirmatory Factor Analysis (CFA) following Duro et al.,6 and Freitas et al.9 We ran two- and one-factor CFA models6; a six-factor model following the conceptualization by Nasreddine et al.1 was not possible due to the small sample size. Model fit was assessed using the following indices:
- Chi-square assessing the adjustment between the model and the observed covariance matrix. A non-significant Chi-square means that the model fits the data well.
- The Root Mean Square Error of Approximation (RMSEA) whose values closer to .06 or very close to 0 suggests a good model fit.
- The Comparative Fit Index (CFI) with values closer to 1 implying a good model fit; this index also has an advantage of reflecting the degree of fit relatively well at all sample sizes. Due to the small sample, it was suggested that a combining rule of a CFI value very close to .95 and an RMSEA value contiguous to .06 was used to minimize the likelihood of type I and type II errors.18
- The Tucker-Lewis Index (TLI) with values of .90 or higher indicate a good model fit.
RMSEA is an absolute fit index, assessing how far a hypothesized model is from a perfect model, while CFI and TLI are both incremental fit indices comparing a hypothesized model with a baseline model.19,20
In the third analysis, we examined the MoCA test score after adjusting for education, i.e. one point was added if a participant had less than 12 years of school, following the MoCA instructions. The score’s distribution and variations by key individual characteristics (i.e. sex, age, and education) were examined. We then assessed MCI classifications with different MoCA cut-offs.11,21 Finally, the criterion validity of the MoCA score was assessed using Pearson correlation with self-reported quality of life (QOL).10 QOL was measured in this study by the OPQOL-Brief; the 13 items are scored from strongly agree (1) to strongly disagree (5), then summed for a total score, with items reverse coded so that a higher score represents a higher QOL. The total QOL score ranges from 13 to 65, with high internal reliability.22 In all analyses, results were considered statistically significant if p-value was less than .05.
RESULTS
Our sample was equally divided between men and women. Participants were between 62 and 82 years of age with the average and the median ages both around 70. Less than one in five had more than 12 years of combined schooling in the US and Vietnam.
Item Analysis
The MoCA item correct response rates were presented in Table 1. Most of the items with high hit rates (of 90% or more) included animal naming in the Language domain, and the identification of month, year, day, and place in the Orientation domain. Contour, Digits Forward, and the first Subtraction did not pose any difficulties to the participants. On the other hand, the most difficult items – those with the hit rates of approximately 30% or lower – centered around the Memory domain with the first two word recalls (Face, Velvet), and the Executive Functions domain with Trail Making, Phonemic Fluency with letter H, and Abstraction with the watch-ruler pair.
Table 2 presented the correlations between each item and the total MoCA score, and between each item and the cognitive domains. Year was not included because it was correctly identified by everyone in the sample. There were several items with no correlations with the total score, including: Chicken, Ox, Phonemic Fluency with letter H, Abstraction 2 (watch-ruler), Word 1 (Face), Word 3 (Church), Word 5 (Red), and City, suggesting that many of these items made little contribution to the MoCA assessment. All other items showed a significant correlation of .30 or more with the total MoCA score.
Examinations of correlations between items and six cognitive domains showed high correlations between most of the items and the domains that they conceptually belonged to; these correlations were positive and statistically significant. Few deviations from the original conceptualization were items that were correlated with a second domain; these correlations were also positive and statistically significant. The list of these domain and item deviations is below:
- Visuospatial skills: Digits Forward, Digits Backward, Subtraction 4, Subtraction 5, Sentence 2, Day, and Place.
- Language: Trail Making, Digits Forward, Subtraction 5, and Abstraction 1.
- Attention: Cube, Contour, Number, Hands, Dog, Sentence 1, Sentence 2, Month, Day, and Place.
- Orientation: Cube, Contour, Numbers, Hands, Dog, Digits Forward, Digits Backward, Letter A, and Subtraction 1.
However, it is important to note that most of these items, while correlated with more than one domain, still had the highest correlation coefficients with the key domain(s) that they conceptually belonged to, except Dog and Letter A, where the differences in correlation coefficients were minimal. All items, except Year, were highly correlated to a domain, suggesting that they had differentiating values.
Correlations between cognitive domains with the total score and with one another were then assessed (Table 3). These correlation coefficients ranged from .48 (Memory) to .79 (Attention), all positive and statistically significant, suggesting construct validity. Attention and Orientation were also correlated with other domains, but the coefficients were lower compared to those with the total score. The correlation coefficient between Language and Executive Functions was .66, slightly higher than that between Language and the total score.
The internal consistency reliability of the MoCA was .797, indicating a very good overall reliability of the scale. It was not significantly improved if Word 3 (Church) or Phonemic Fluency, or both, was removed.
Confirmatory Factor Analysis (CFA)
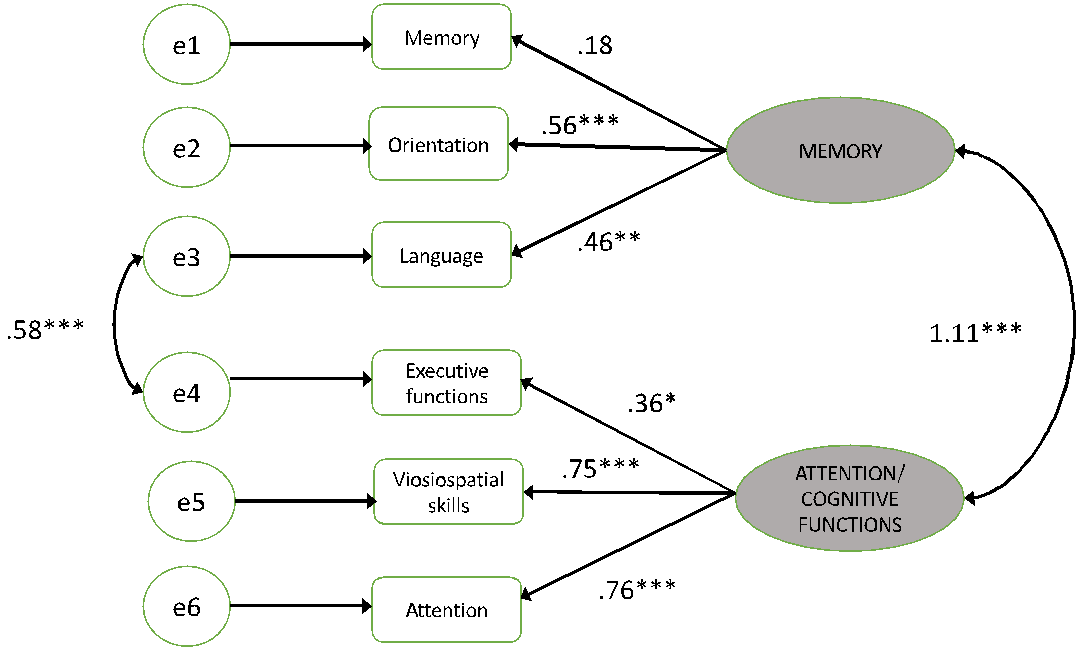
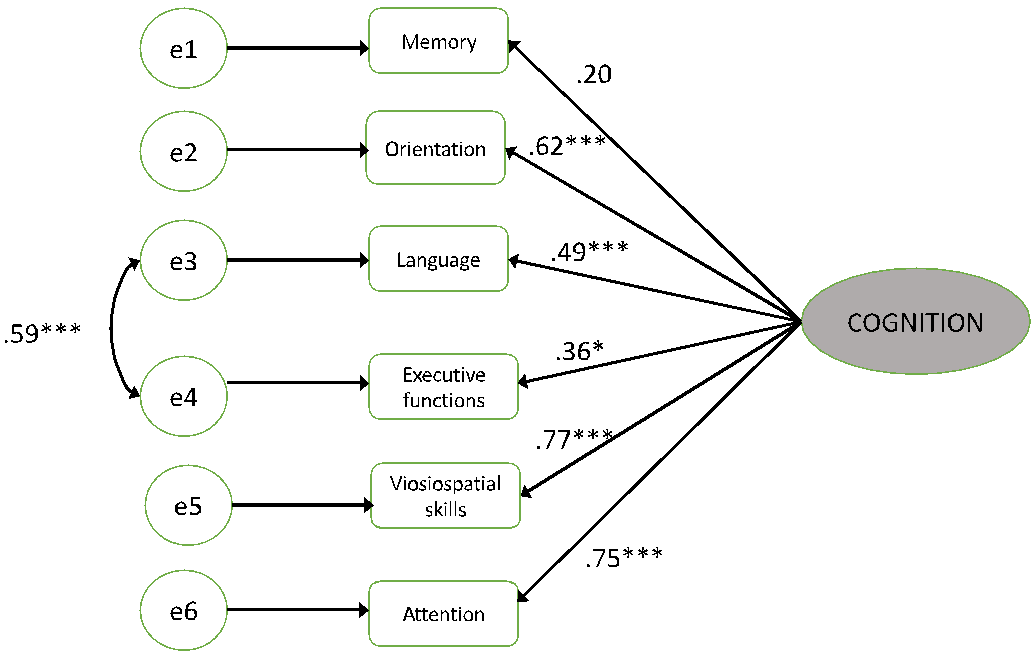
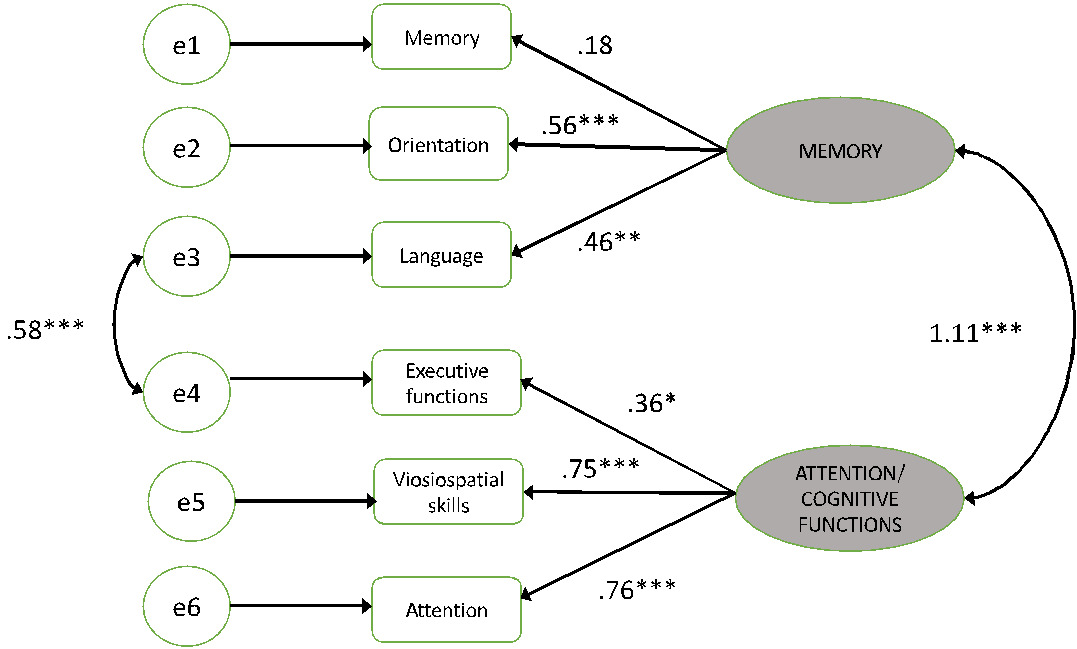
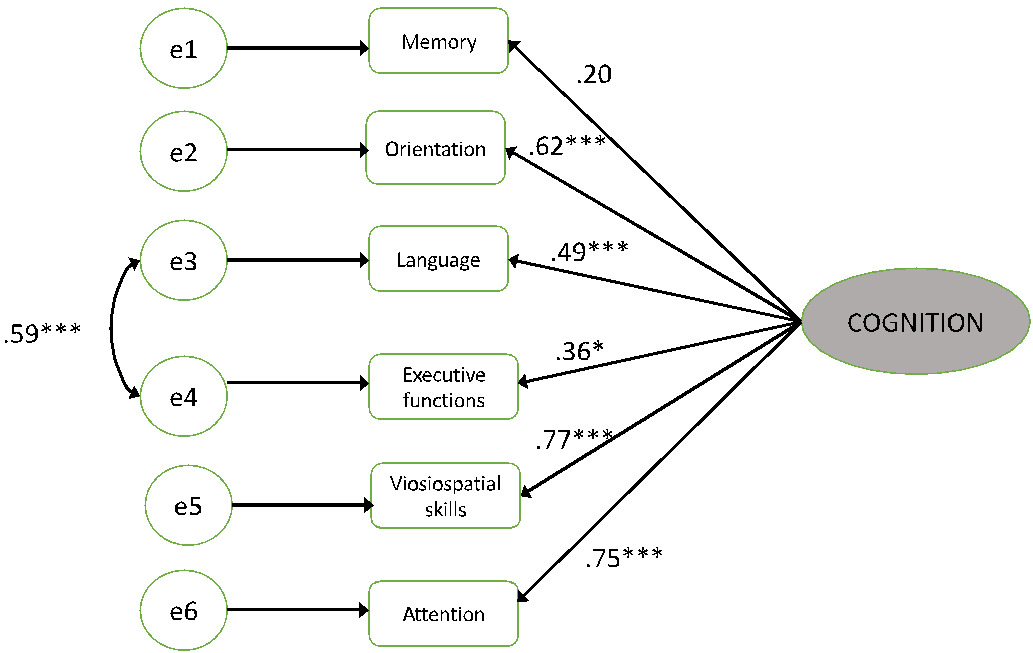
We present next results from two- and one-factor models. In the two-factor model, the first factor MEMORY included Memory, Language, and Orientation, and the second factor ATTENTION/EXECUTIVE FUNCTION included Attention, Executive Functions, and Visuospatial Skills. The one-model factor consisted of all domains considered to contribute to an underlying latent factor called “cognition.” Each model was run with and without adjustment for the correlation of the error terms between Language and Executive Functions, as they were found to have the highest correlation of the error terms among the domains.
Table 4 presents fit indices of the CFA models. While there was little difference between two- and one-factor models, findings showed that allowing covariances between Language and Executive Functions resulted in models (b) with improved fit indices. Further examinations of items belonging to these two domains showed that most items had high, statistically significant correlations with both domains in the same direction. The differentiating items for Language were: Chicken, Dog, and Ox; whereas the only differentiating item for Executive Function was Abstraction 2 (watch-ruler).
The regression coefficients in two- and one-model factors were summarized in Figures 1 and 2, respectively; these models included covariances between Language and Executive Functions. The one-factor model had a higher coefficient of determination (.79) compared to the two-factor model (.73), suggesting that the former explained more variation in the latent variable “cognition” than the latter. Both models satisfied the combining rule of a CFI close to .95 and an RMSEA close to .06. The Memory domain was related to neither the MEMORY latent variable in the two-factor model nor the cognition latent variable in the one-factor model.
Variations of the MoCA adjusted score
The MoCA score, adjusted for education, ranged from 7 to 29, with the average of 21.25 (s.d.=4.27) and the median of 22. The Pearson correlation coefficient between the MoCA adjusted score and the QOL score was .61 (p<.05), indicating a relatively high correlation.
Table 5 showed that the MoCA adjusted score only varied significantly by sex. Female participants, on average, scored lower than male participants: 19.67 vs. 22.83 (p<.05) and the coefficient was -.31 (p<.05). It is important to note that female participants had fewer years of education than male participants (7.5 years vs. 10.88 years, p<.05), and 8.33% of females compared to 29.17% of males had more than 12 years of education. This means that female participants were more likely to receive one additional point to their MoCA score, yet still had a lower average score than their male counterparts.
Finally, we explored the percentages of MCI diagnosis should lower cut-offs be applied. Table 6 indicated that the conventional cut-off of 26 would result in nearly 90% of the sample screened as MCI positive. A lower cut-off of 24 yielded a 64.6% MCI and a cut-off of 23 would yield an MCI prevalence of 56.3%. Only with the two lower cut-offs would we see variations in the percentages of MCI by sex, where MCI was more prevalent among female participants than among male participants.
DISCUSSION
Overall, our findings indicated that the MoCA test in Vietnamese language performed well and consistently in this sample. Individual items and most of the cognitive domains exhibited high internal consistency, indicating strong conceptual relationships between them and with the total score. Criterion validity was also high as indicated by the correlation between the MoCA and the QOL scores. Finally, we found that sex of participants was the only differentiating factor between low versus high MoCA scores.
The CFA analysis suggested that the test performed statistically better with covariances between Language and Executive Functions. These domains already had the Phonemic Fluency item in common, which displayed similar correlations with the two domains. Several items that conceptually belonged to one domain were found to also be correlated with the other, although the correlation coefficients were lower with the second domain than with the first. It is plausible these two domains currently do not include items with strong discriminating values, a question that should be further explored.
It is important to note that the Memory cognitive domain did not show correlations with the total MoCA score and the other domains, in both item analyses and CFA. Although we did not significantly modify the words in this domain, with the exception of Word 2 (Velvet), recall of these words was relatively low and had the lowest correlation with the total score. A possible explanation is that these words, while often used in the Vietnamese language, could be difficult for our participants to retain when used out of context, while our participants did not seem to have trouble repeating the two complete sentences. The finding could also suggest that the Memory domain in the current form may not be culturally appropriate. Perhaps a different, more appropriate list of stand-alone words could help increase the performance of the Memory domain among this population.
An unexpected finding is that education was not a discriminating factor of the adjusted MoCA score. A reason may be that education has already been accounted for in the adjusted MoCA score. It may also be due to the homogeneity of the sample, where nearly 90% of the sample had 12 years of schooling or less. A larger and more diverse sample may yield different results.
Our analysis also suggests several items that can be further modified to be more culturally sensitive. For example, all pre-test participants had trouble understanding the instructions for the Trail Making item; even after revisions, the majority still found it challenging. Thus, we believe that participants’ performance on this item, and several others with low hit rates, may not adequately represent their cognitive abilities. On the other hand, items with hit rates of nearly 100% would unlikely contribute to early detection of MCI in a community setting.
Finally, while our study did not include a clinical diagnosis of MCI, the performance of the MoCA test in our sample of VA older adults suggests that a lower cut-off score would likely have more screening values than the conventional cut-off of 26. This finding is consistent with those from other studies with Asian populations. In 2013, Fujiwara et al. employed the Japanese version of the MoCA test (MoCA-J) to examine characteristics of older adults among Japanese community-dwellers aged 65 to 84 years.23 Although the study indicated that the MoCA-J was highly effective in screening for a wide variety of MCI in a community setting, it also highlighted that the conventional MoCA score cut-off of 26 was not always appropriate.23 In another study, it was concluded that the MoCA-J cut-off of 23 rather than 26 might be more useful to predict cognitive function among community-dwelling Japanese older adults.24 In a recent study employing the MoCA test in Chinese, researchers highlighted that less educated elderly people in China had difficulties understanding the instructions, which may have led to lower MoCA scores.25 The same bias was noted among a cohort of functionally independent older adults aged 65 and above in Hong Kong, leading to false positives.26 These studies indicate the need to further assess the MoCA test to determine appropriate cut-offs, depending on the social and contextual factors of the target population.27 The conventional cut-off of 26 may be too high among minority groups leading to impairment misclassifications.21,27–29
This type of bias may be particularly relevant for the Vietnamese population, but there is much uncertainty due to the scant availability of MoCA test validations among this group.27 VAs often have lower levels of education and health literacy than other Asian Americans, and relatively high incidences of conditions comorbid with cognitive decline. For example, the Pew Research Center30 found that 52% of foreign-born VAs attained no more than high school education, compared to 29% of the general Asian American population. Additionally, only 34% of foreign-born VAs, compared to 70% of the general Asian American population, were considered English proficient.30 Compared to several Asian American subgroups, VAs had one of the lowest levels of health literacy.31 Even among VAs with adequate health literacy, limited English proficiency was associated with worse health status.32
Our study has some limitations. First, our community-based sample without a clinical diagnosis prevents us from a discriminant validity analysis, where the MoCA score can be compared between those with and without an MCI diagnosis. Such an analysis would have been useful to 1) further analyze the utility of the MoCA test and its subtests, and 2) suggest a MoCA score cut-off that may have clinical values. Nevertheless, our study still suggested that a lower score cut-off should be used for this sample and potentially other VA older adult populations. A related limitation is that QOL was the only factor used for criterion validity in this study. Future studies should investigate the correlation between the MoCA score and other measures that have previously been used, including other screening measures of MCI (e.g. MMSE), or measures of daily activities.6,10 Finally, the study had a small sample size, yet it appeared to adequately assess the reliability of the testing methodology. The small sample prevented a six-factor model as suggested by Nasreddine et al.1; however, we believe that the one- and two-factor models provided strong evidence of the test’s construct validity. Another consequence of the small sample size is that it was not possible to test potential covariates and differentiating factors, other than age, sex, and education as the results may not be robust. In addition, it is possible that VA older adults participating in this study might have been more healthy than average older adults in the Vietnamese community, which might have resulted in several test items with near perfect hit rates. Again, a larger, more diverse sample size would be important to overcome this limitation.
In summary, our examination of the performance of a Vietnamese version of the MoCA tests has important practical implications for the screening of MCI among an important immigrant population in community settings. Our analysis demonstrated that this version of the MoCA test had an overall psychometric detection adequacy as well as good internal reliability. The construct and criterion validity was also good. This modification of the MoCA test is viewed as a reliable, and likely valid, instrument for MCI screening among VA older adults. Our study suggests areas for adaptation and improvement to improve the discriminating power of items and subtests.
Acknowledgement
This study was funded by a grant from the National Institutes of Health “Assessment of and Barriers to Treatment for Alzheimer’s Disease and its related Dementias (AD/ADRD) within the Vietnamese American Community in New Orleans, LA” (P01 HD082032 04S1, PI: Mark VanLandingham. The authors acknowledge with gratitude the enthusiastic and steadfast support from our community partners, including the West Bank Seniors Club (Mr. Toan Nguyen, President), New Orleans East Community Health Center (NOELA CHC, Ms. Diem Nguyen, Chief Executive Officer), and their staff and volunteers for their support and participation. Our community partners were instrumental in the recruitment of participants for the study’s fieldwork. Lily Friedman provided highly valuable research assistance. We are also thankful to Dr. Roger Kelley (Louisiana State University Health Sciences Center LSUHSC) for his guidance in the modification of the test, and for his comments on an earlier draft of this manuscript.
Current Affiliations
Bonnie Khanh Ha Bui is currently an independent researcher affiliated with the National Coalition of Independent Scholars; Trang Nguyen is currently a lecturer at Vietnam National University’s University of Social Sciences and Humanities, Hanoi, Vietnam.
Role of the funding source
The funder has no involvement in the design of the study, in the collection, analysis and interpretation of data, the writing of the manuscript, and in the decision to submit the article for publication.
Funding
This study was funded by a grant from the National Institutes of Health “Assessment of and Barriers to Treatment for Alzheimer’s Disease and its related Dementias (AD/ADRD) within the Vietnamese American Community in New Orleans, LA” (P01 HD082032 04S1, PI: Mark VanLandingham.
Conflicts of Interest
The authors declare that there are no conflicts of interest.
Availability of data of material
Data can be made available upon request and following the guidelines of the NIH.
Code availability
All analyses were conducted with the Stata statistical software, version 15.
Authors’ contributions
All authors, led by Mark Vanlandingham, contributed to the study conception and design. Material preparation, data collection and analysis were performed by Mark Valandingham, Mai Do, Bonnie Khanh Ha Bui, NhuNgoc K. Pham, Trang Nguyen, and Cam-Thanh Tran. Philip Anglewicz reviewed the analysis. The first draft of the manuscript was written by Mai Do (lead writer), with Bonnie Khanh Ha Bui, NhuNgoc K. Pham, Lauren Nguyen, and Trang Nguyen contributing to various sections. All authors commented on previous versions of the manuscript, and have read and approved the final manuscript.
Ethics approval
Ethical approval No. 2018-2046 was obtained from the Tulane University’s Internal Review Board (IRB) in New Orleans, LA.
Consent to participate
All participants gave consent to participate prior to the interviews. The informed consent form, approved by the Tulane University IRB, included this statement.
Consent for publication
All participants gave consent to publish results from the study, using de-identified data, prior to the interviews. The informed consent form, approved by the Tulane University IRB, included this statement.