INTRODUCTION
Globalization and Forth industrial revolution, as well as COVID-19 pandemics, have greatly affected individual career pathways and career development all around the world1). Meeting demands of a global society, where transition across the boundaries of occupations, organizations,2 and countries is more frequent than in previous generations, requires adequate readiness to cope with changing work and work conditions; namely, career adjustment.3,4
The concept of career adjustment was proposed almost four decades ago as an alternative to the notion of professional maturation,5 and it is most often defined as a psychosocial construct denoting a person’s readiness and capacity to cope with inevitable ongoing developmental tasks, job changes and personal traumas.3,4,6 The concept was elaborated by Savickas3,4 within the Career construction theory; the theoretical ground that has been most commonly used in research pertaining to professional adaptability.6
The above mentioned theory, as well as other classical approaches to career development,6 is based on the paradigm which emphasizes the role of rational processes and behavior.7–9 Recognizing that the rational paradigm offers limited interpretations, several authors suggest that some further personal psychological resources for career adjustment, such as unconscious motivations10,11 or unconscious barriers12 should be considered. Thus, taking into account the empirical evidence in favor of the relevance of unconscious dynamics, it would be more appropriate to recognize career decisions and strategies as a product of the mutual influence of rational/conscious and intuitive/unconscious processes.7,11,13
In order to enable evaluation of implicit and less conscious dynamics in career adjustment processes, Dynamic Career Scale (DSC) is developed and validated in Italian context. The instrument is grounded in a psychodynamic conceptualization, focused on understanding of the career as the symbolic object that is given an affective meaning,11,14 and that contains a complex external object including different aspects of reality such as work context, professional status, relationships with colleagues and managers and professional achievement, but also a complex internal object that includes self-image, goals and abilities.8
The DCS measurement model is based on four relevant dimensions which are taken from the Melanie Klein’s object relation theory, and can be understood as symbolic and relational dynamics potentially coexisting and interacting: true reparation, manic reparation, mania and envy. True reparation is, on the one hand, a way to preserve a good internal object, i.e. self, by developing ego-capacities, and on the other hand, preserving a good external object, i.e. reality contact, through facing loss and damage and put in efforts in reparation. Therefore, true reparation can be understood as the capacity to successfully overcome professional challenges and failures by relying on one’s own efforts and commitment to personal development. Manic reparation also tends to repair the internal object and to relate with the external world, but it does not originate in guilt and in authentic intent to remediate, but relies on omnipotent and magical ways of repairing harm. Although it can be a way to reduce the guilt and to increase self-confidence,15 it is associated with an overestimation of one’s own capabilities and a narcissistic and grandiose approach to career building.8,16,17 Mania, i.e. manic defenses18 refers to a regressive way of functioning when the self loses confidence in its own capacities to perform reparation and rests on primitive defense mechanisms such as splitting or denial. It is a primitive strategy based on rejection and giving up on career decision making, as well as on avoiding goals related to career building and adjustment. Envy, as the angry feeling that another person possesses and enjoys something desirable, followed by an impulse to destroy it, can arise when manic defenses are not effective enough. Envy is characterized by the devaluation of career opportunities and negative attitude towards the career success of others, which is manifestation of hostile dynamics that results in self-disruptive behavior.19–21
The great advantage of this instrument is that it provides the empirical basis for the explanation of the irrationality of a career decisions and strategies that may be maladaptive and self-sabotaging.
The aim of this study was to translate and culturally adapt the Italian original version of Dynamic Career Scale into Serbian language and to evaluate psychometric properties of Serbian form.
METHODS
Sampling and procedure
A cross-sectional study was conducted during the period March to June 2018 among student population attending University of Belgrade. Students were selected using a multiphase sample design. In the first phase four groups of faculties (Social Sciences and Humanities, Medical Sciences, Sciences and Mathematics and Technology and Engineering Sciences) were identified as the main sampling strata, and from each stratum three clusters (faculties) randomly were selected. In the second phase, random sample of students from each of the 12 faculties was formed, and first 3 years of study programs were identified as the strata. Within each stratum, a specified number of respondents were chosen systematically, with the probability proportional to the total size of the students attending the selected faculties. We have approached 514 students with response rate of 95.5%.
Intentionally avoiding sending requests to personal e-mail in order to preserve student anonymity and privacy, the questionnaire was disseminated in classrooms during the breaks between the lectures. The questionnaire took ∼20−25 min to complete.
Study instruments and measures
Dynamic Career Scale (DCS) consists of four sentences describing the most common job situations, referring to: (1) job search and establishment, (2) job assessment and feedback, (3) job achievement and success, and (4) job advancement and promotion. For each sentence, four items denoting thoughts that could come to mind in facing the career situations presented in the sentences were listed. Thus, the respondent was presented with the set of 16 items, scored on a 7-point Likert-type scale, ranging from 1 (not at all) to 7 (completely), indicating to what extent he would have such a thought if he were faced with the previously described situation. The items were developed in order to assess four dimensions: true reparation, manic reparation, mania and envy. Dimensions are defined as different forms of reaction when facing professional challenges and failures. The first two dimensions refer to reactions aimed at the reparation of professional failure and the realization of professional goals: either (1) by improving one’s own abilities and efforts (true reparation) or (2) by relying on omnipotent compensation and magical solutions (manic reparation). In contrast, the other two dimensions represent avoidance responses to potential efforts to confront professional failure: either (3) rejecting professional goals and denying their importance (mania) or (4) sabotaging and wish to get others into trouble (envy).14
The original version of the DCS was translated from Italian into Serbian in four phases.22 In the first phase, three professional translators independently translated the original scale. In the second phase, the researchers together with the translators compared the original version of the instrument and the translations, and reconciled the differences. In the third phase, a member of our research team, bilingual in Serbian and Italian and familiar with Serbian culture, translated the final versions of the questionnaire from the previous phase back into Italian. In the fourth stage, the original and the version that were translated in the third stage were reviewed again. Face validity was tested in a pilot study involving 10 undergraduate students. The items are found to be clear and easy to understand.
Socio-demographic questionnaire includes following variables: gender, age, academic year, academic field, father’s education, mother’s education, family income and the current grade point average. The variable ‘family income’ is defined by the average of per capita family wage and divided in following five categories: very poor (≤250 €), poor (250 − 350 €), moderate (350 − 450 €), good (450 − 550 €) and very good (≥550 €).
Data analysis
The factorial structure of DCS was examined applying exploratory factor analysis (EFA) and confirmatory factor analysis (CFA). In order to perform the analyses, the total sample was randomly split into two subsamples (NEFA=263, NCFA=251) in which EFA and CFA were performed separately. Comparing two subsamples regarding their age, gender, faculty and year of study, no significant differences were found. Maximum likelihood method with oblimin rotation was performed. Kaiser−Meyer−Olkin (KMO) was used to measure sampling adequacy. Bartlett’s test of sphericity and total variance explained were applied for the evaluation of factor analysis. Factor loadings were used to keep or drop items. Internal consistency was determined by calculating Cronbach’s α coefficient. Values equal to 0.7 and above were considered as satisfactory. Descriptive statistics were used to detail the sample characteristics. The association between the scores was examined using the Pearson coefficients and multiple linear regressions. All the analyses were performed using the statisti‐cal programs SPSS 24.0 and AMOS 18.0. In all analyses p < 0.05 was considered statistically significant. Distributional properties of the DCS were examined to test the normality of the total scores, and values for skewness and kurtosis between − 2 and + 2 were considered acceptable.23
RESULTS
Baseline characteristics of respondents
The median age was 20 years, and more than half of respondents were female (66.0%). For more than half of the students who reported their material situation family income could be categorized as poor or very poor (55.7%). The data are presented in Table 1.
Testing validity with EFA
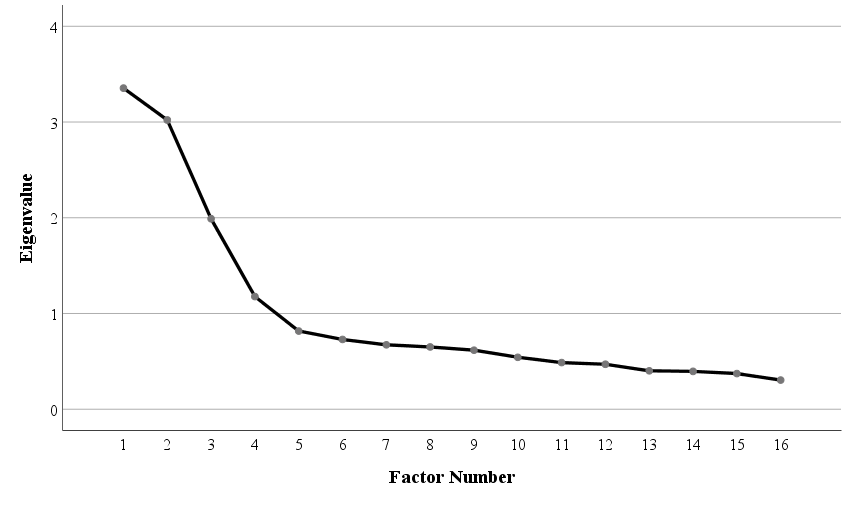
The values obtained by the Kaiser-Meyer-Olkin method (KMO=0.78) and Bartlett’s test of sphericity (χ² (120) = 1297.835, p < .001) indicated that the sample was adequate and that the correlations between the items were high enough so factor analysis could be applied. Applying EFA, four factors with eigenvalues above 1, ranging from 3.33 to 1.21, and explaining 60.29% of the variance were extracted. Considering the data obtained by Kaiser’s criterion and the graphic representation (Figure 1), we can conclude that there are four dimensions. Factor saturations obtained by EFA are shown in Table 2.

Confirmatory factor analysis
The CFA was run to cross-validate the factor structure identified by EFA. The results obtained by CFA indicate an adequate four-factor model fit (χ² =173.779; df = 98; χ²/df = 1.773; CFI = .930; RMSEA = .056 [90% CI: .042, .069]; SRMR = .065). Saturation measures on all factors are statistically significant (p˂0.001) and the dimensions of mania, envy, manic reparation and true reparation were loaded only by items within the dimensions defined by the theoretical model (the lowest saturation was 0.43 and the highest 0.82).
Reliability and correlation analysis
Descriptive statistics, reliabilities and correlations between the four dimensions are shown in Table 3. Crombach’s alpha for the subscales ranged from 0.65 to 0.82. With the exception of association between envy and manic reparation (p˃0.05) all the other correlations were statistically significant. True reparation was negatively correlated with envy (p˂0.05) and mania (p˂0.01), and positively associated with manic reparation (p ˂0.01). On the other hand, the dimension of mania has a statistically significant positive correlation with the dimensions of manic reparation (p˂0.01) and envy (p˂0.01).
Socio-demographic correlates
Based on the results shown in Table 4, it can be concluded that men are more prone to mania (r=0.11, p˂0.05). Also, there is a low but statistically significant positive correlation between the average grade and the envy (r=0.10, p˂0.05).
True reparation is statistically significantly more pronounced among respondents studying sciences and mathematics (β=0.12, p˂0.05) and medical sciences (β=0.11, p˂0.05) compared to those from technology and engineering fields. At the same time, students from the fields of sciences and mathematics (β=-0.11, p˂0.05) and medical sciences (β=-0.13, p˂0.05) had a statistically significantly less pronounced mania, compared to students of technology and engineering sciences (Table 5).
Further results presented in Table 5 indicate the existence of a statistically significant correlation between the father’s education and the strength of envy among the examined students. Compared to students whose fathers have just primary education, the envy is more pronounced in those whose fathers have secondary (β=0.51, p˂0.01), undergraduate or graduate (β=0.44, p˂0.01) and postgraduate education (β =0.35, p˂0.01).
In addition, mother’s educational level was significantly correlated with true reparation. Students whose mothers had secondary (β=0.35, p˂0.05), undergraduate or graduate (β=0.45, p˂0.01) and postgraduate education (β=0.40, p˂0.05) had less pronounced true reparation compared to those whose mothers have just primary education.
Additional results showed that there was significant correlation between the family income and manic reparation. Students reporting very good family income had significantly higher scores on manic reparation compared to respondents with good (β=-0.20, p ˂0.001), moderate (β=-0.20, p˂0.01), poor (β=-0.22, p˂0.001) or very poor income (β=-0.25, p˂0.001).
DISCUSSION
Based on the results of the empirical evaluation of validity of the Dynamic Career Scale (DCS), we can conclude that the four-factor model previously obtained on the Italian sample14 was confirmed on the sample of Serbian students. Our results indicated the existence of a statistically significant negative association between true reparation and mania and envy, which is in accordance with the theoretical assumptions of the model. The existence of a low, but statistically significant correlation, between the true and manic reparation is a potential indicator that, regardless of the fact that they are qualitatively different and independent constructs, these two dimensions are mutually similar and can coexist. At the same time, mania was statistically significantly positively related to manic reparation and envy, probably due to the presence of manic feelings. On the other hand, an interesting finding is that there was no correlation between the manic reparation and envy, and this result requires additional research.24,25
Comparing the reliability coefficients from the Serbian adaptation of the DCS to the Italian version8 it can be observed that the internal consistency of the items for the true reparation, manic reparation and mania obtained in Serbian sample was higher. In addition, we observed that while manic reparation, mania and envy were expressed to a similar degree in both samples, true reparation was more pronounced in Serbian sample. We can assume that this result is a consequence of the differences in the contemporary political and historical context in Serbia and Italy. When a person perceives himself as a member of a social group, that group belongingness forms an integral part of the self, and the position and actions of the group, as well as the attitude of others towards that group, can cause certain emotions in the individual as well.26 The need for reparation presupposes the existence of guilt.27 Thus, when the modern history of a nation (group) is marked by war events, as it was in Serbia, due to the experience that the group to which one belongs (not necessarily a specific individual) did evil to another group, the feeling of guilt is more pronounced.28
Our finding that male students are more prone to mania is consistent with the findings of previous research showing that men are more inclined to rely on projection as a defense.29,30 The obtained finding can be interpreted in the light the psychodynamic theory. During the period of earliest development, both girls and boys are initially attached to their mother and they identify with her. However, in the course of development, as the boy begins to recognize his greater physical resemblance to his father, the nature of his identification changes, shifting from a maternal to a paternal figure.31,32 Identification as a defense mechanism allows one to become like the parent with whom he has a conflict, that is, in relation to whom there is fear, thus reducing the anxiety associated with that conflict. Therefore, in order to build his identity, the boy should separate from his mother and identify with the father, focusing on actively finding the place in the outside world relying on assertiveness and sometimes aggression.32 This process results in “outward orientation” by shifting internal threats to the external world through projection, making this mechanism occurring more often in the male population.30
Furthermore, although the obtained correlation is low, our findings indicate that stronger envy is associated with a higher grade point average. It can be assumed that envy, operationalized as we did in this study, could still be a driver of better achievement,33 but this assumption should be examined in more detail in some subsequent research.
Students attending medical sciences and sciences and mathematics were more prone to rely on true reparation, and less prone to resort to mania, compared to students of technology and engineering sciences. Certain career theories34–37 claim that professional identity can be understood as the results of the need of the self to repair internal objects through the vocational choice. Thus, one of the explanations could be that in medical science and science and mathematics, considering the study subject, there is a greater investment in the object, hence the more frequent reliance on the mechanism of true reparation and less often on the mechanism of mania.38,39
The respondents whose fathers had just primary education were significantly less inclined to rely on envy. It is possible that due to identification with their fathers, these students do not have such high internal demands that would lead to perfectionism and unfavorable comparison with others. At the same time, true reparation is most pronounced among students whose mothers have the lowest educational level. Taking into account the strong affective attachment between mother and child, it is possible that, when the mother has a lower education there is a stronger need for reparation of the internal object of the mother.
Students with the higher family income rely on manic reparation in a greater extent. One of the explanations could be that people being in less favorable financial situation rely less on manic reparation, considering that improvement and progress in reality still require concrete effort. Young age, that is, the short life experience in students living in better conditions, may be an additional factor contributing to more frequent reliance on manic reparation. Namely, it is possible that due to the lack of life experience, these respondents did not have many opportunities requiring reliance on true reparation.
We want to emphasize that all the interpretations of the relationships between the career adjustment and socio-demographic variables presented here are only preliminary assumptions that should be verified in some future research.
Several limitations can be noted in this study. Firstly, the sample included only student population. To improve the generalizability, future studies should include other populations with different professions, and different work status as well. Secondly, due to limited time and resources, test-retest reliability was not conducted in this research, and it would be suggested for further research.
Funding
This research did not receive any specific grant from funding agencies in the public, commercial, or non-profit sectors.
Conflicts of interest
The authors declare that there is no conflict of interest.
Ethical statement
The study was approved by the Ethics Committee of the Faculty of Medicine, University of Belgrade.